


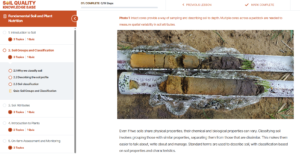
GRDC Podcast: Yield response to P fertiliser
GRDC caught up with Senior Research Scientist Craig Scanlan about...
Read More
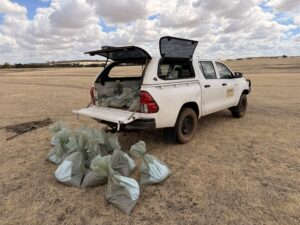
GroundCover: New knowledge to tap residual soil phosphorus
Unlocking legacy phosphorus may be a key to improved sustainability...
Read More
Early bird rates end soon for SSA National Conference
Soil Science Australia members and non-members planning to attend November’s conference get a discount if they register by the end of July.
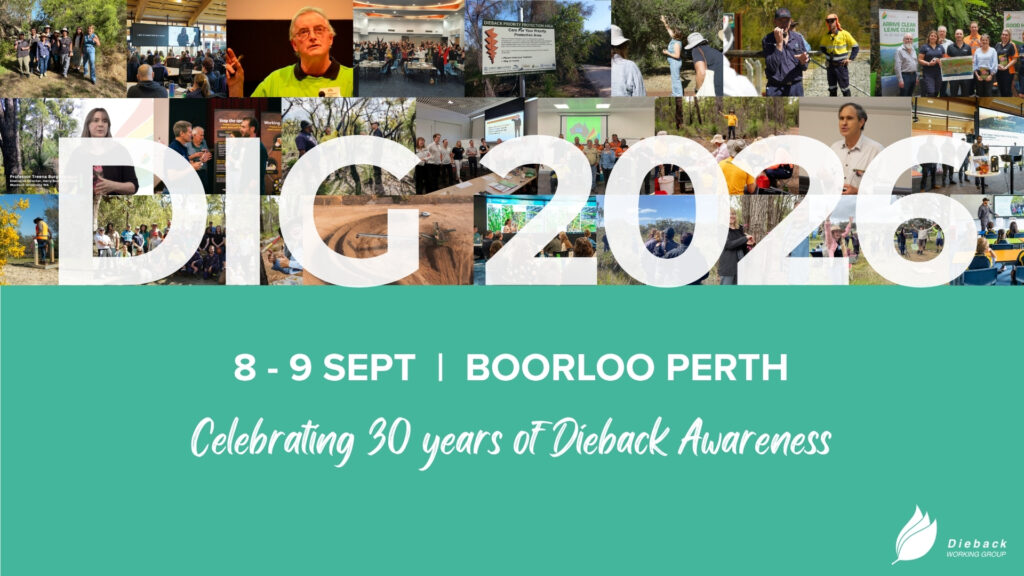
Dieback milestone conference to be held at Murdoch
The Dieback Information Group Conference 2026 will include presentations from Professor Treena Burgess, Dr Sarah Sapsford and Mr Bob Du, who represent Murdoch University’s Harry Butler Institute (HBI).
Steady, or carbon goes
Murdoch University’s Emeritus Professor Richard Bell and Wheatbelt Natural Resource Management’s Aimee Mouritz discussed soil carbon in a recent podcast.
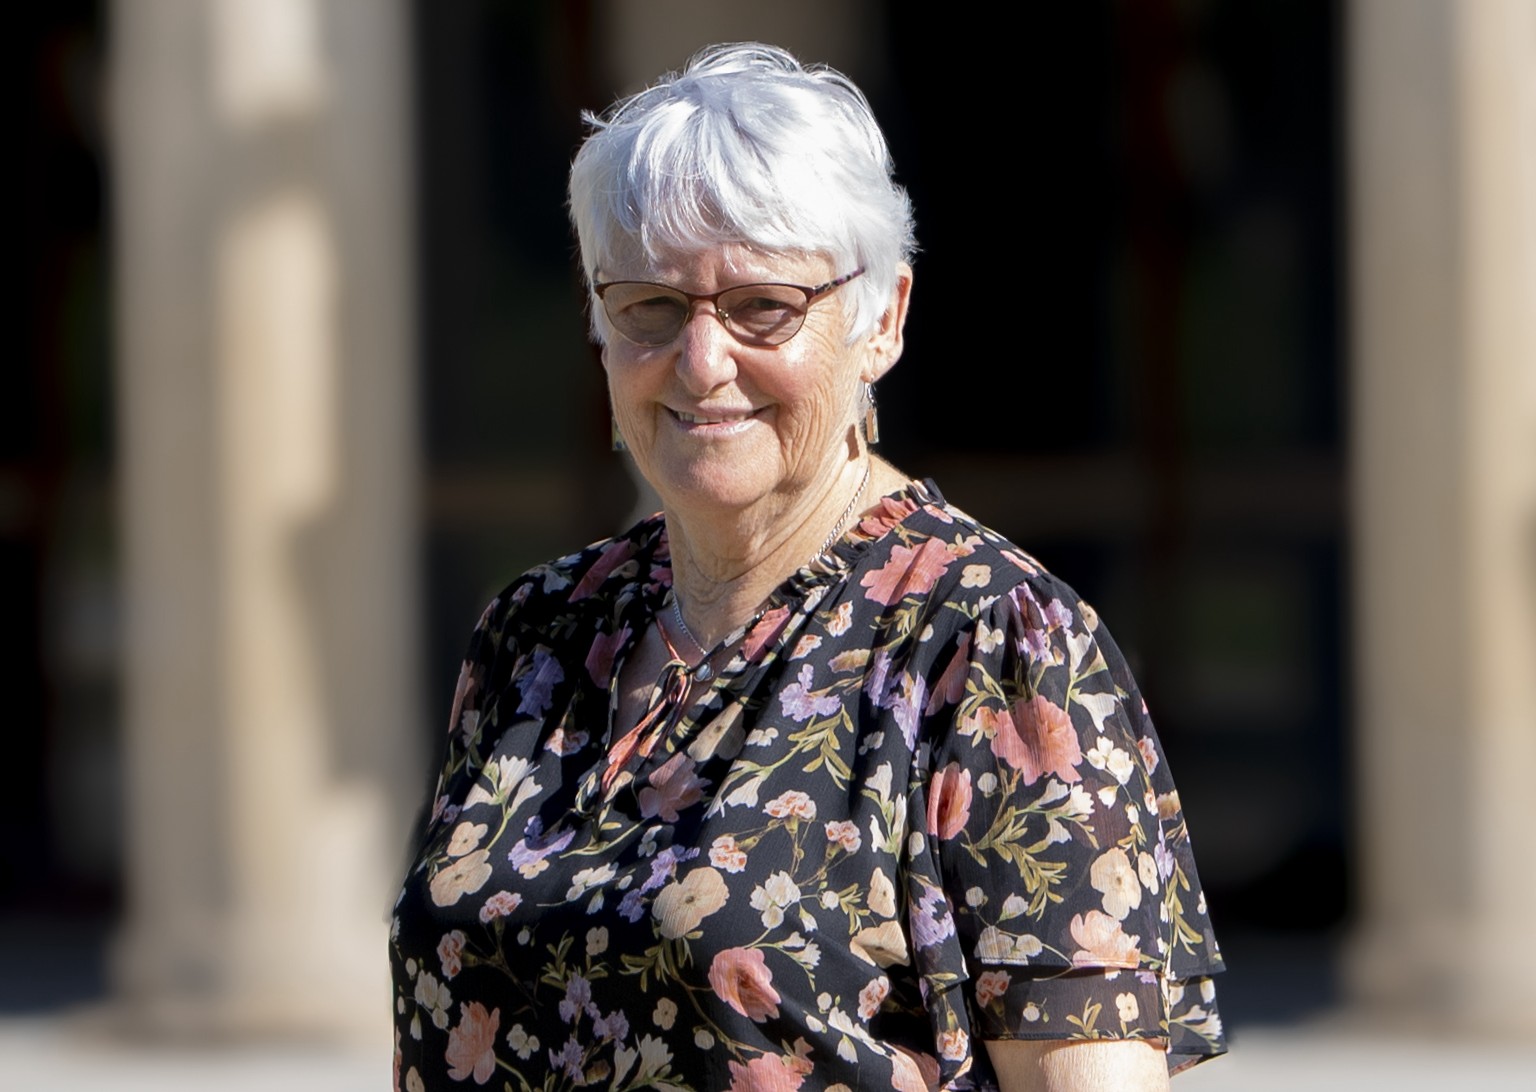
A quick dig with … Lyn Abbott
The University of Western Australia’s Emerita Professor Lyn Abbott AM reflects on an academic research and teaching career that recently culminated in national recognition. Congratulations, Lyn.